Printable Lab Results Log Sheet
Everything runs in your browser — nothing is uploaded
Common settings
Shared by all templates
Template settings
Printable Lab Results Log Sheet
All templates
View all →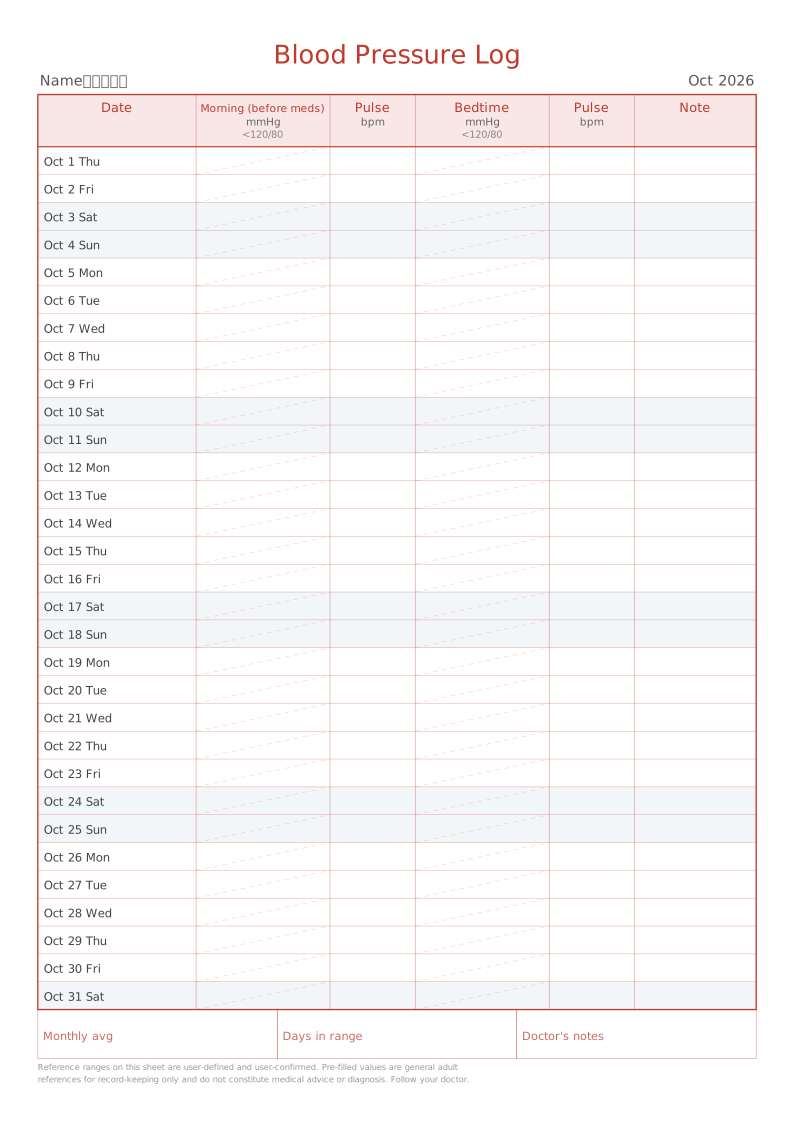 Printable Blood Pressure Log SheetSystolic, diastolic and pulse readings by week or by month
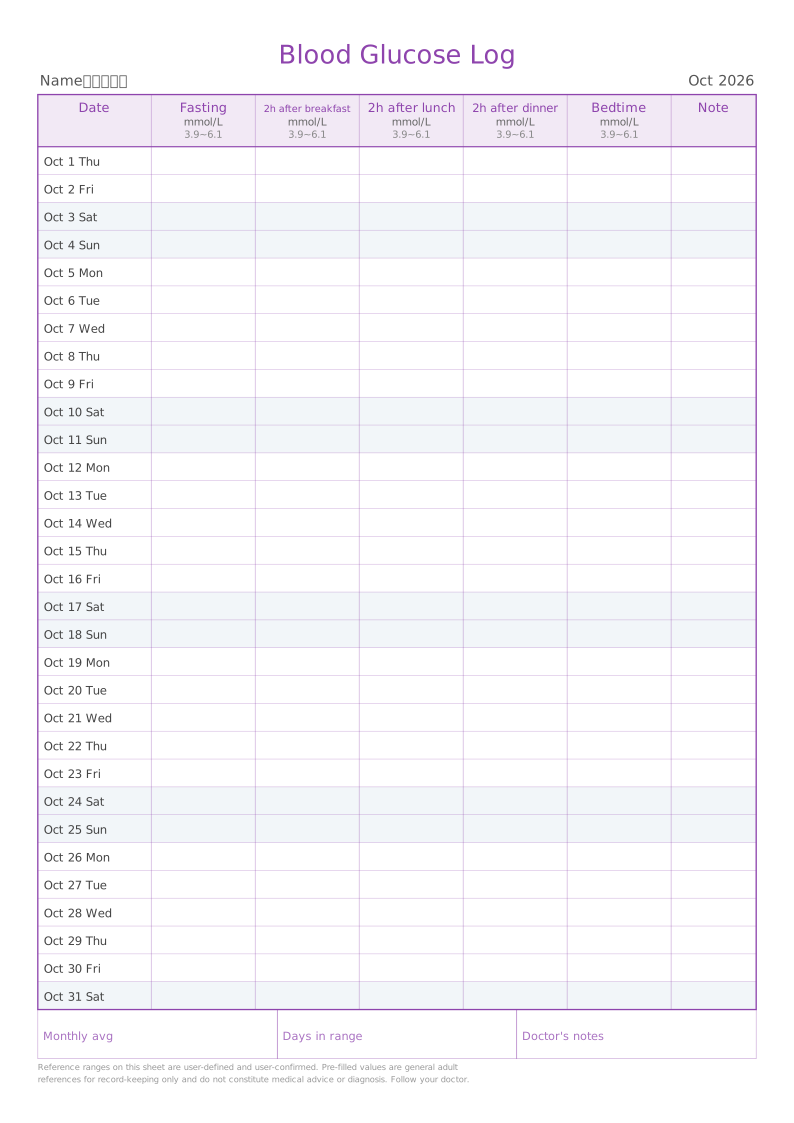 Printable Blood Sugar Log SheetFasting, post-meal and bedtime readings, up to a 7-point profile
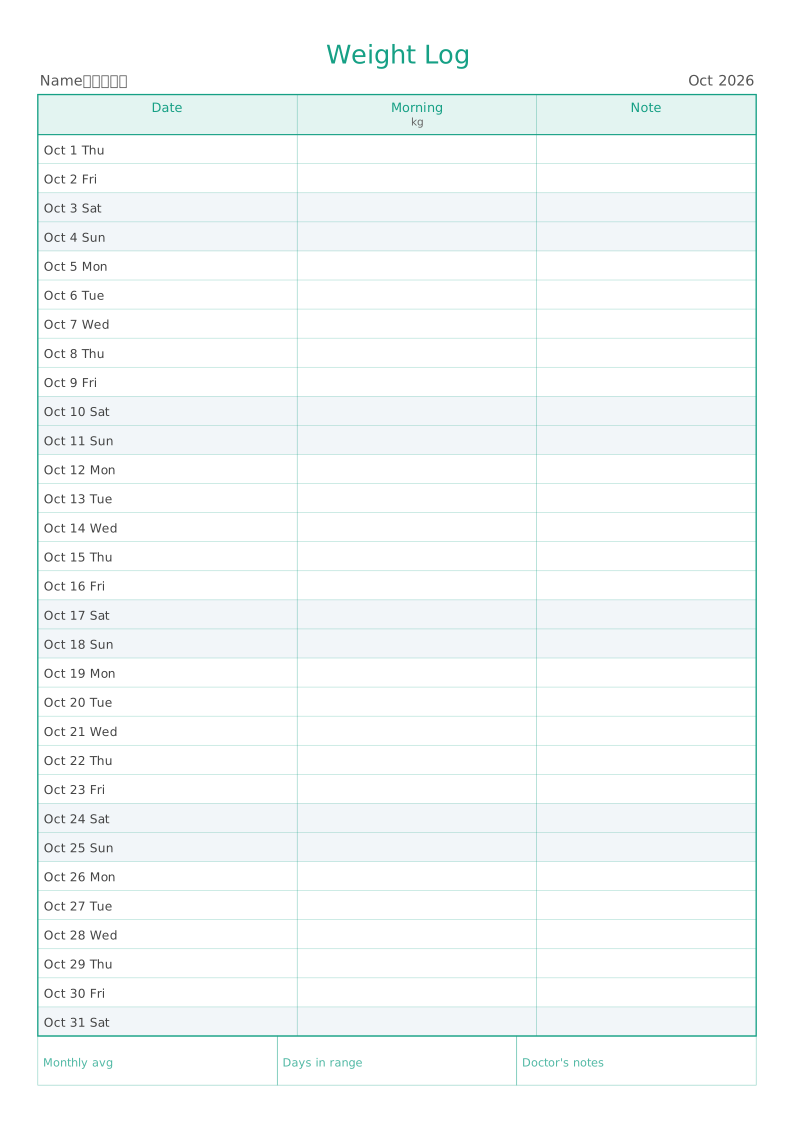 Printable Vitals Tracking ChartWeight, temperature, heart rate, SpO₂ and other daily readings
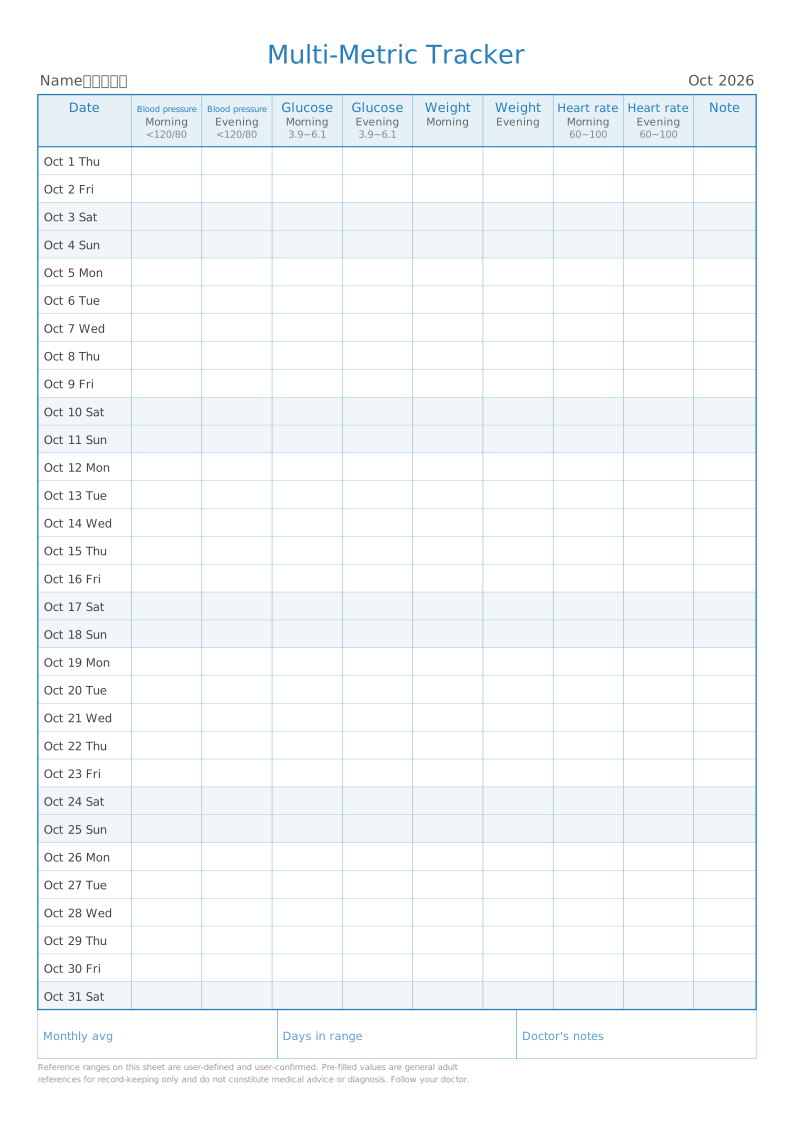 Multi-Symptom Vitals TrackerSeveral readings side by side, laid out as metric by time of day
 Printable Lab Results Log SheetCompare lipid panels, uric acid, HbA1c and other test resultsCurrent
About Printable Lab Results Log Sheet
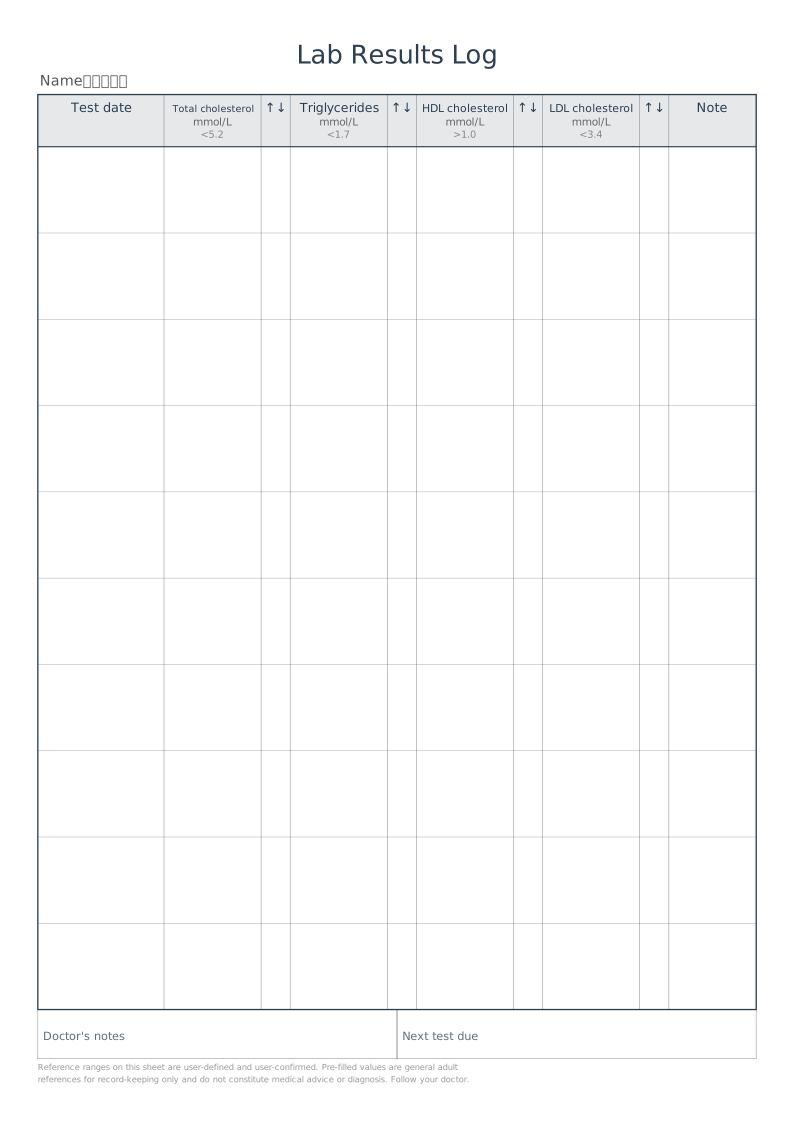
One row per test: the date on the left, each analyte with its reference range across the row, and a narrow arrow column beside every test to mark results that fall outside the range.
Read the full guide to Printable Lab Results Log Sheet: details, usage and FAQ
Typical uses
- Comparing lipid panels across annual check-ups
- Tracking uric acid and creatinine for gout
- Quarterly HbA1c records for diabetes
- Liver function follow-ups while on medication
FAQ
Why is this the transpose of the blood pressure sheet?
Lab work happens every few months and returns several results at once, so "one row per test, one column per analyte" fits better. Blood pressure and glucose are measured several times a day, which is why those use one row per day.
Why are the printed dimensions wrong?
If your print dialogue has "Fit to page" enabled or scaling below 100%, the whole grid is scaled down. Set scaling to 100% / "Actual size", and tick the calibration ruler in the generator, then measure the 5 cm mark with a ruler. PDF dimensions are locked in the file, so they are the safest option.
Does anything I type or upload get sent to a server?
No. Generation, preview and export all happen inside your browser. Nothing is uploaded and no account is needed.
Related templates