Multi-Symptom Vitals Tracker
Everything runs in your browser — nothing is uploaded
Common settings
Shared by all templates
Template settings
Multi-Symptom Vitals Tracker
All templates
View all →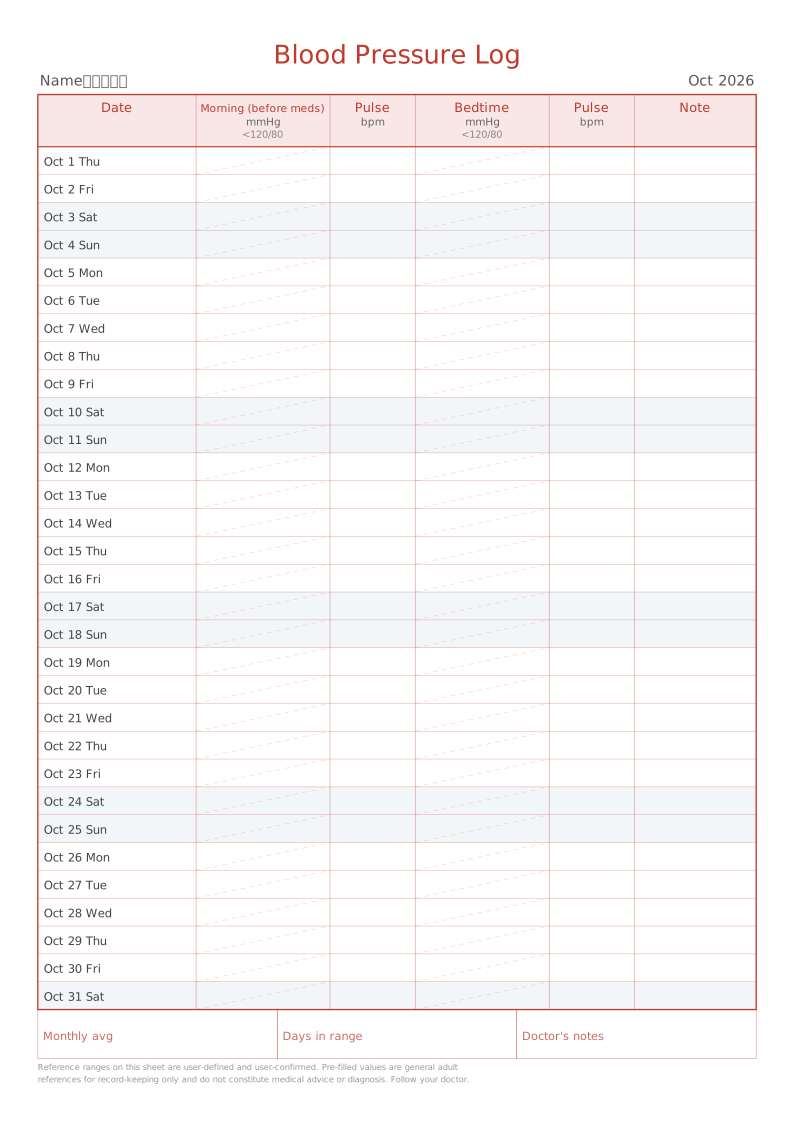 Printable Blood Pressure Log SheetSystolic, diastolic and pulse readings by week or by month
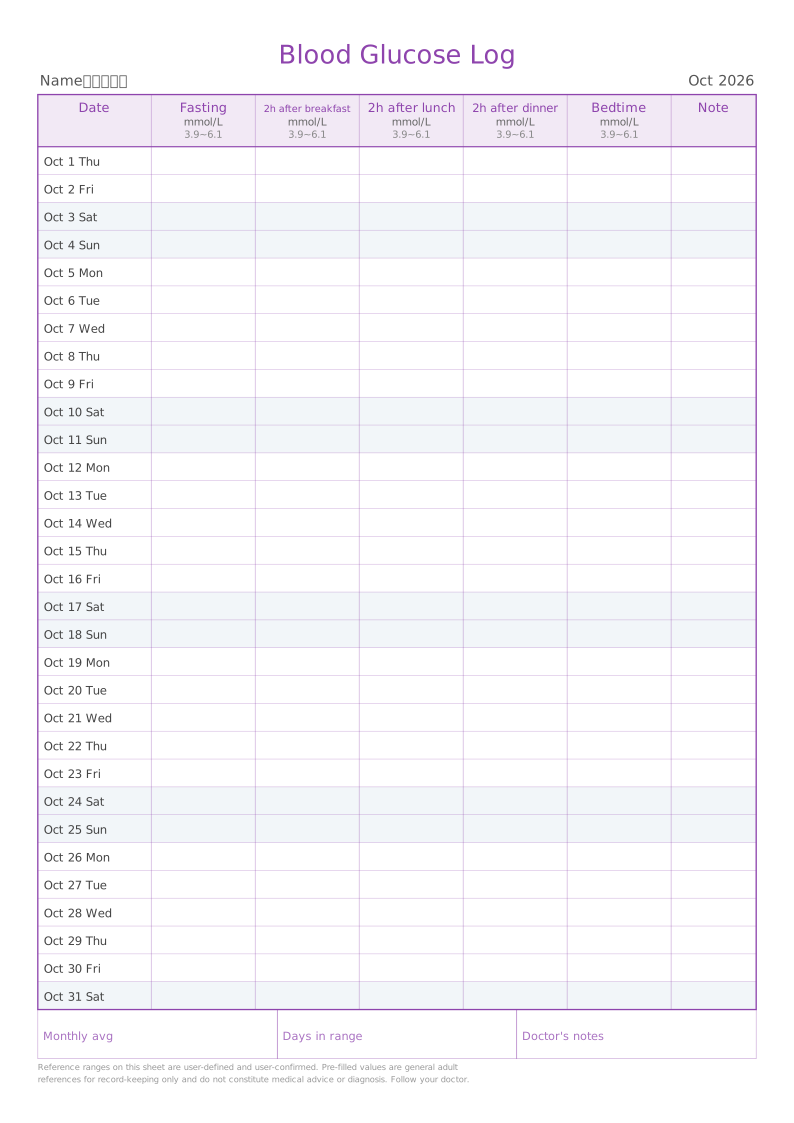 Printable Blood Sugar Log SheetFasting, post-meal and bedtime readings, up to a 7-point profile
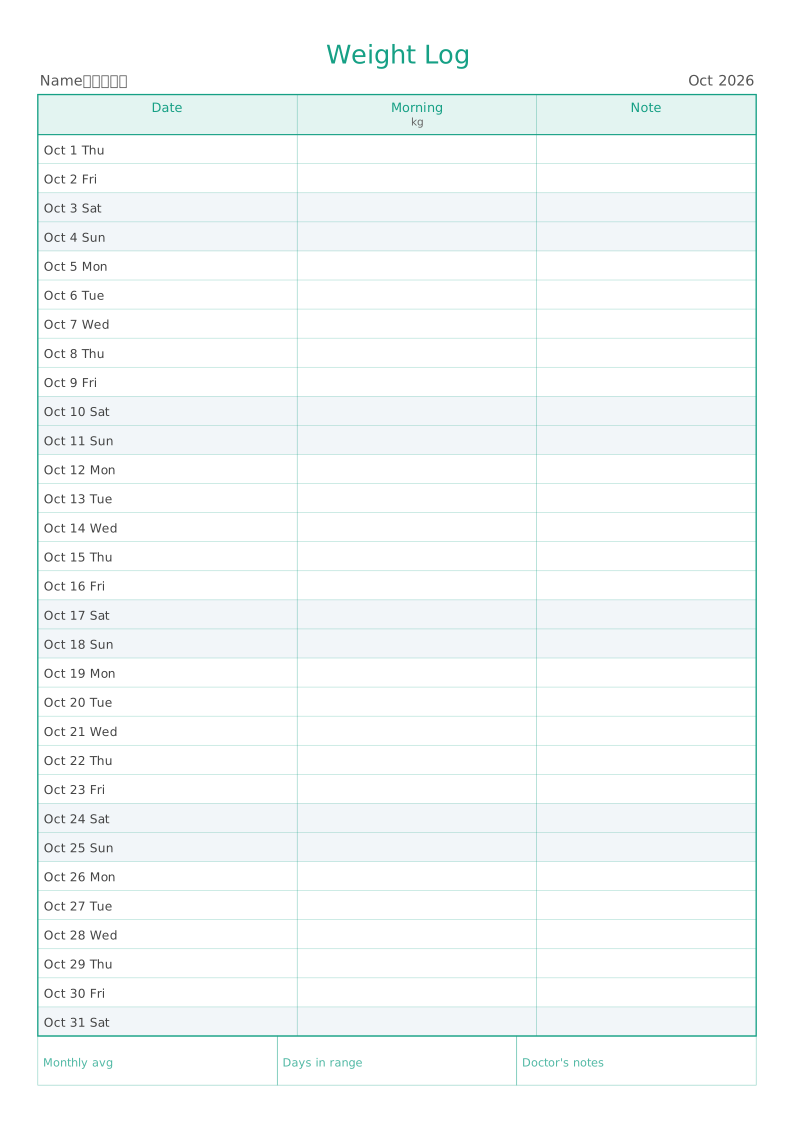 Printable Vitals Tracking ChartWeight, temperature, heart rate, SpO₂ and other daily readings
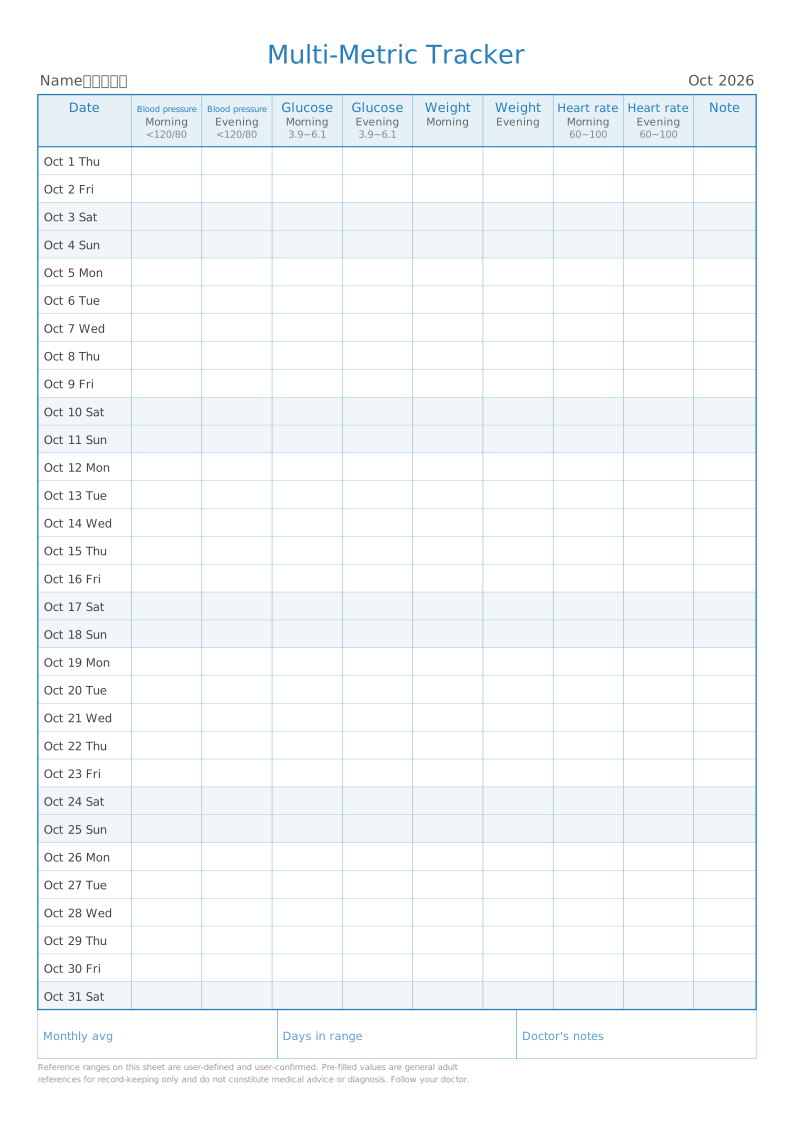 Multi-Symptom Vitals TrackerSeveral readings side by side, laid out as metric by time of dayCurrent
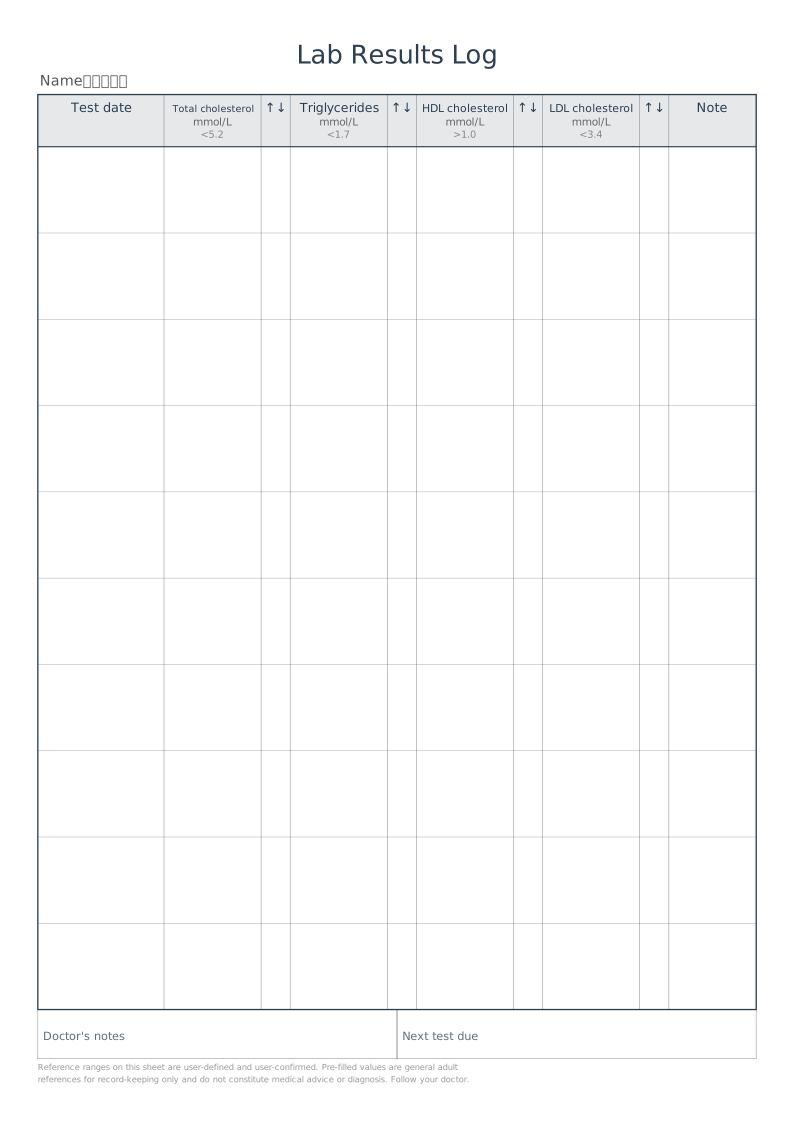 Printable Lab Results Log SheetCompare lipid panels, uric acid, HbA1c and other test results
About Multi-Symptom Vitals Tracker
Rows are dates, columns are metric × time of day, so everything measured on the same day lines up horizontally. Metric names and reference ranges are entered as comma-separated lists, up to eight metrics.
Read the full guide to Multi-Symptom Vitals Tracker: details, usage and FAQ
Typical uses
- Chronic care: blood pressure, glucose and weight side by side
- Fat loss: weight, heart rate and sleep together
- Post-surgery recovery: temperature, pain and heart rate in one place
- A one-page health overview for your doctor
FAQ
Why is there no in-cell scale here?
The metrics have very different ranges (temperature 35–42, weight 30–150), so a shared scale would mislead. This sheet keeps the reference range text in the header instead.
Why are the printed dimensions wrong?
If your print dialogue has "Fit to page" enabled or scaling below 100%, the whole grid is scaled down. Set scaling to 100% / "Actual size", and tick the calibration ruler in the generator, then measure the 5 cm mark with a ruler. PDF dimensions are locked in the file, so they are the safest option.
Does anything I type or upload get sent to a server?
No. Generation, preview and export all happen inside your browser. Nothing is uploaded and no account is needed.
Related templates